Figure 1: Our estimated levelized carbon intensities of 12 different power plants showing nuclear and wind power having the lowest levelized CO2 emissions over their operating lifetime. In the figure SUB is sub bituminous coal, BIT is bituminous coal, NGCT is natural gas combustion turbine, NGCC is natural gas combined cycle, CCS is 90% carbon capture and sequestration, PV is solar photovoltaic, Res is residential, CSP is concentrating solar power, and wind refers to onshore wind.
Using data from the Energy Institute’s 2016 Full Cost of Electricity Study, we estimate the levelized carbon intensity for 12 different fuel and technology combinations for newly constructed power plants. The levelized carbon intensity is estimated by dividing a power plants’ emissions over its lifetime by the total expected electricity output. We estimate that nuclear and wind power, at 12 and 14 g CO2-eq (grams of CO2 equivalent) per kWh of electricity, respectively, have the lowest levelized carbon intensity of all the power plant options we considered. While we have calculated different values for nuclear and wind power, the difference is within the margin of error. Solar energy had the third-lowest levelized carbon intensity, at 41-48 g CO2-eq per kWh of electricity.
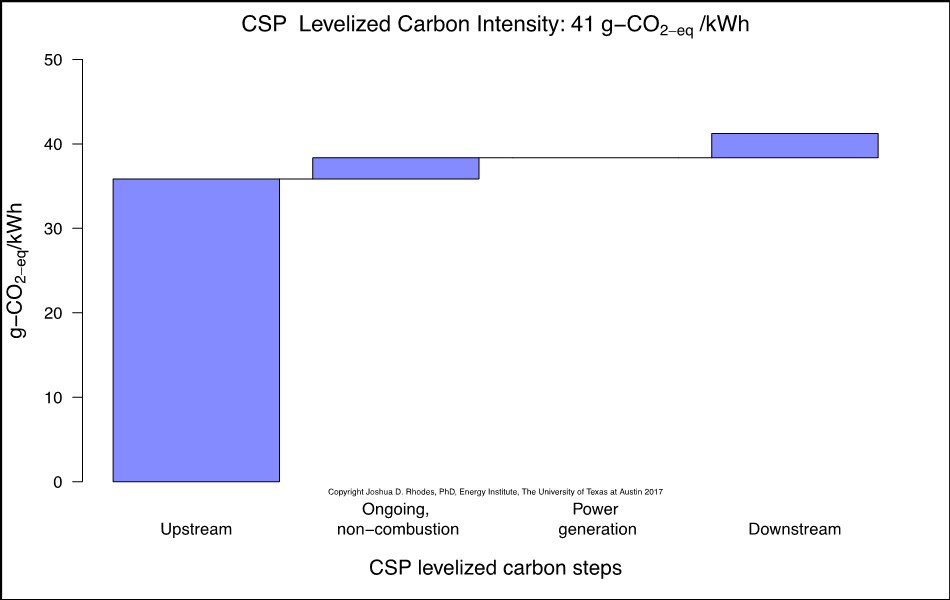
We tallied the CO2-eq impacts at six stages in a power plant’s lifecycle: 1) upstream, 2) on-going, non-combustion, 3) power generation, 4) carbon sequestration, 5) fugitive methane emissions and 6) downstream. Not all stages applied to every power plant and were omitted from an individual power plant’s charts if they did not apply, e.g., CCS for a non-CCS plant. Data for 1-3 and 6 were taken from NREL’s harmonization of life cycle analysis studies summarized in Table C-1 of Volume 1 of the Renewable Energy Futures Study. That study described the categories as follows. Upstream includes “emissions resulting from raw materials extraction, materials manufacturing, component manufacturing, transportation from the manufacturing facility to the construction site, and on-site construction.” Ongoing non-combustion includes “fuel cycle emissions (where applicable) and emissions resulting from non-combustion-related O&M activities.” Power generation includes emissions “from combustion at the power plant (where applicable) for the purpose of electricity generation.” Downstream includes “emissions resulting from project decommissioning, disassembly, transportation to the waste site, and ultimate disposal and/or recycling of the equipment and other site materials.” Carbon capture and sequestration values are assumed to reduce combustion CO2 by 90%, but CCS plants have more up and downstream embedded emissions because of their larger amount of on-site capital. Fugitive methane emissions were calculated based on the heat rate of the power plant and an assumed 1% leakage rate in US natural gas infrastructure. A global warming potential of 30 was used to convert the leaked CH4 to CO2-eq.
Other notable power plant options that we did not consider are hydroelectric, geothermal, and biomass. Hydroelectric power plants are very clean during operation, but have significant upstream emissions from their construction and from organic matter anaerobically decomposing under the reservoir. Geothermal power plants generally have low emissions. Biomass power plants have high emissions during operation, but on lifecycle have low emissions because of the carbon fixed during the fuel’s growth phase. We did not consider any carbon emissions associated with long-term spent fuel storage, which is particularly relevant for nuclear power. We did not consider coal bed methane emissions, though fugitive emissions from the natural gas system were included.
The following figures illustrate our estimates for levelized emissions from each of the 12 power plant options over their lifecycle stages.
For more, contact Dr. Joshua Rhodes, research fellow at UT Austin’s Energy Institute: joshdr@utexas.edu or @joshdr83
For media requests, contact Gary Rasp: grasp@energy.utexas.edu or 512-471-5669